Orchestras
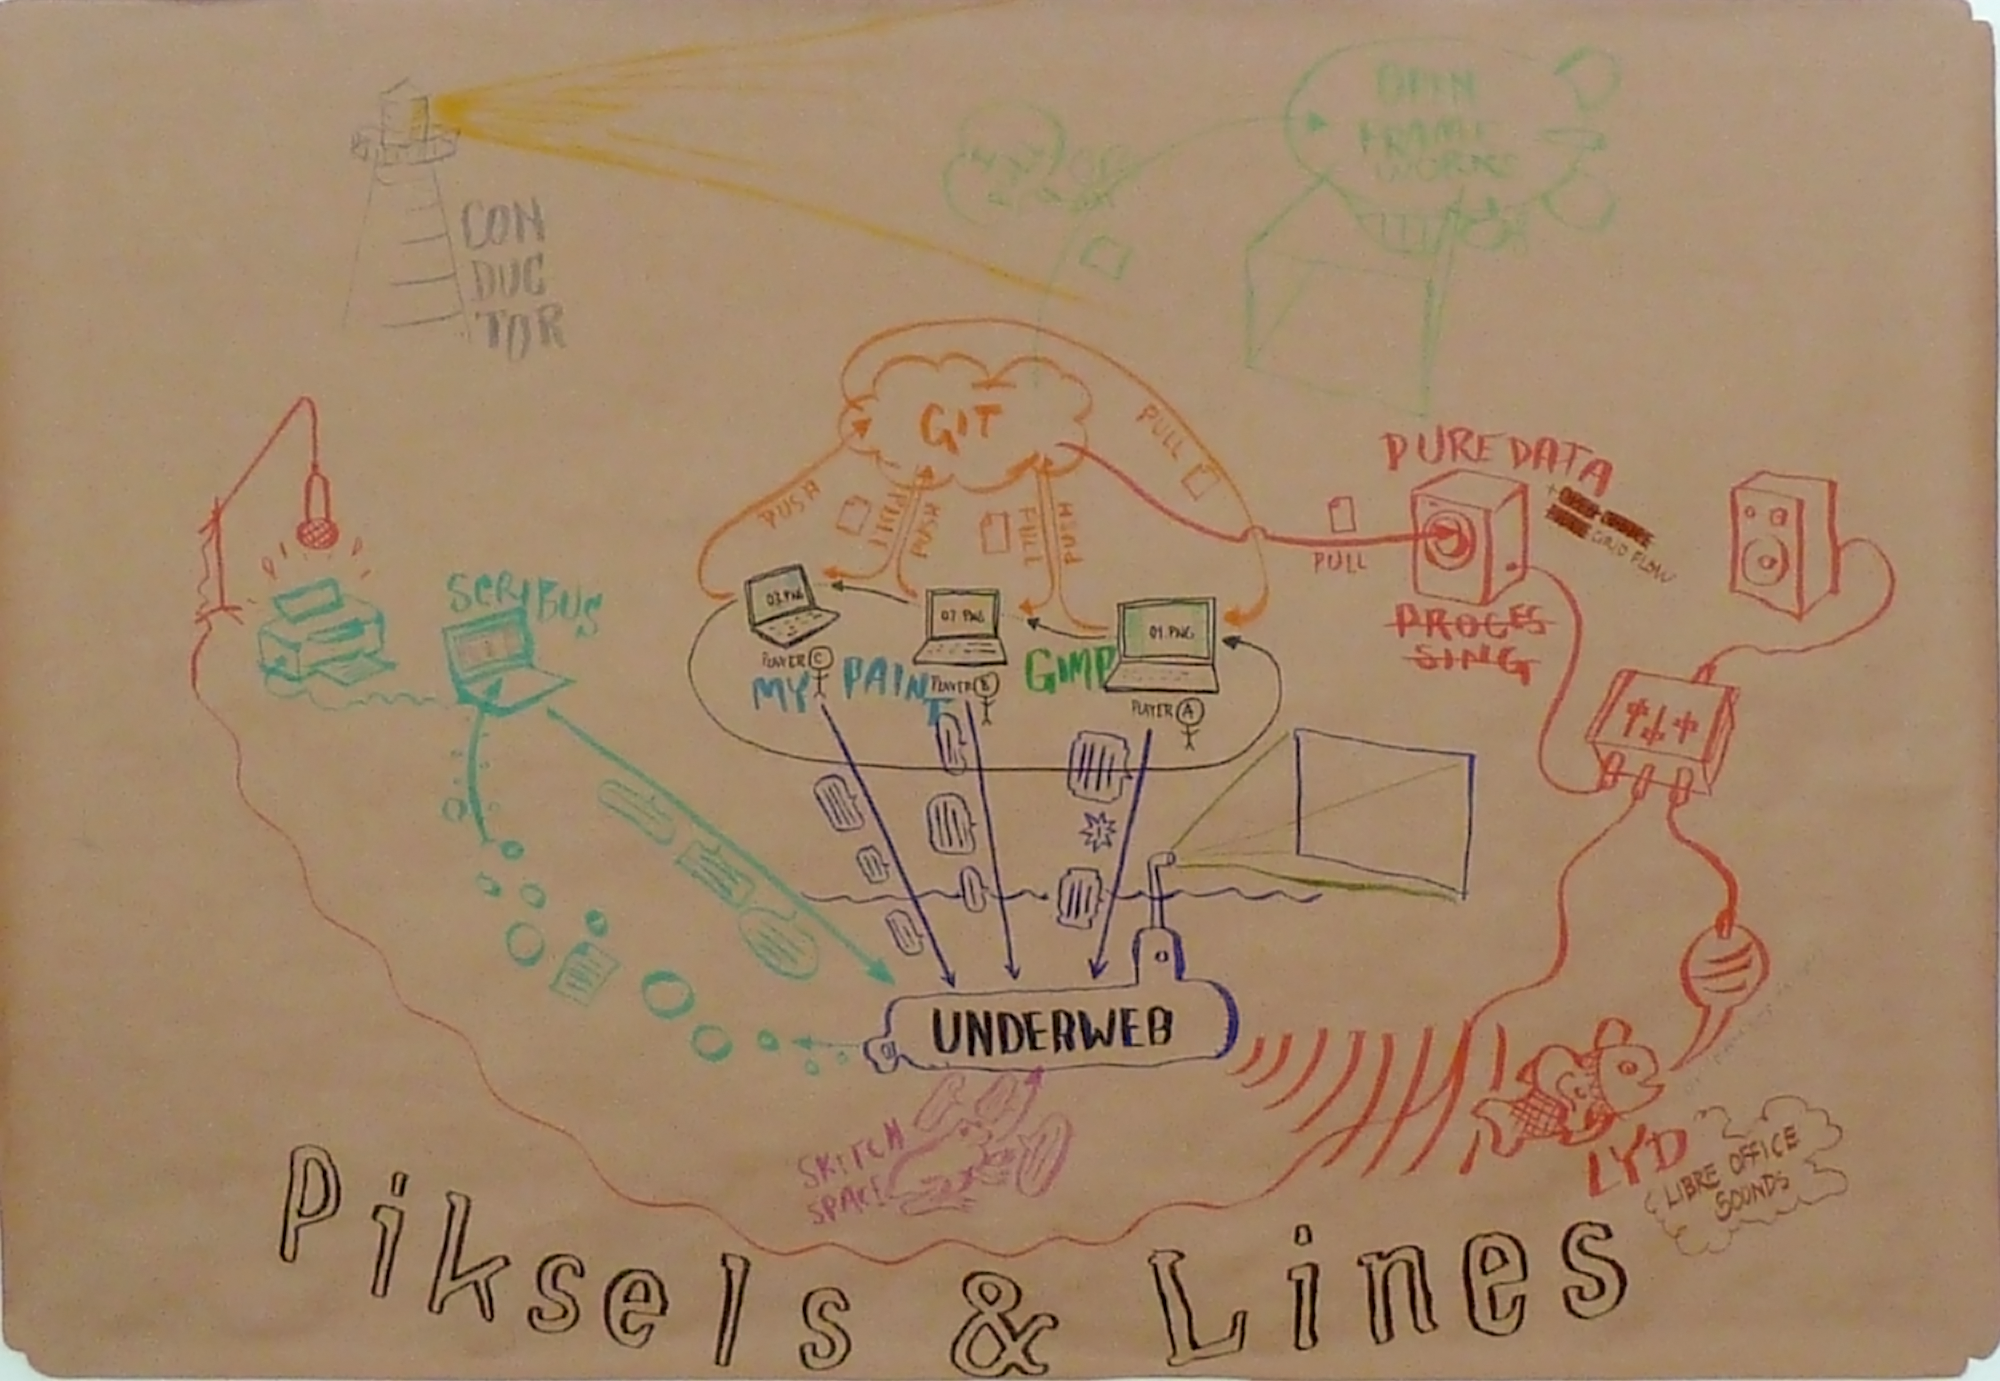
Piksels and Lines Orchestra map, Ana Carvalho, Pierre Huyghebaert and others (Bergen, 2012)
We are interested in tools that have ways of expressing their own character, and that are open for inter-action between processes. The prototype for a Piksels and Lines Orchestra (PLO) was an experiment with three important features missing from most digital tools: sound feedback for experiencing lay-out differently, ways to enjoy the process of collaboration and a view on internal vocabularies. This sketch for a PLO was developed by The Libre Graphics Research Unit. In a single afternoon, several well-known Libre Graphics tools were networked using standard protocols. ‘Instrumented’ versions of Scribus, MyPaint, SketchSpace and GIMP were made to send their actions (everything that was saved to the undo-history) as HTTP GET requests to The Underweb. Any completed brushstroke, transform or text-change made by any of the Orchestra’s instruments could be displayed on a screen. From here, Lyd was used to sonify actions with the help of the LibreOffice soundlibrary. Simultaneously, players were saving their results into a git-repository. A PureData-patch then pulled from the repository and provided ambiant sounds based on processing the outcomes of playing the instruments. Finally, an OpenFramework-script visualised changes to the growing image-collection on-screen.
The players of the Orchestra delivered two sets of about an hour experimenting the improvised connections between design-production and experimental sound. The differences in tonality between the various instruments were obvious, even if this was just a try-out for a possible Piksels and Lines Orchestra. Scribus offered the widest spectrum of sounds, as it’s action-history is fine-grained, and the wide variety of operations clearly defined. The range of sounds produced by MyPaint appeared to be less varied then we expected; to turn a drawing tool into an instrument, it might have been more interesting to take mouse-positions and speeds into account. Although exciting because it being the only web-accessible instrument, SketchSpace remained ambiguous as an instrument due to it’s high granularity of actions that made it hard to actually perceive causal relations between a change on canvas and it’s sonification. Adding sound-feedback to lay-out broke the usual boredom of putting elements to the grid. The pleasure of connecting these different tools through a minimum of negotiation allowed them to express their character to each other.
How about?
How to experience Libre Graphics work other then through the final outcome? How to listen to a pixel, or to the tune of a line? What could be the performative potential of lay-out and drawing? And how could all of this play together? We could imagine using these rediscovered features in a new way to break the silence, introversion of software and to change their opacity.
Exercise
- Produce a lay-out with multiple people with tools that are ‘instrumented’. Record some sequences of sound and design. See how the process of one modifies the other, back and forth. Modify the tools to be able to live tune the instrumentation, and to share the process, like with one person layouting, the other one instrumenting.
- Libre Graphics Radio: find a way to broadcast the rhythm of daily digital work in the Libre design studio.
Laidout distribute align tool
https://www.youtube.com/watch?v=Gs8k4KUSkJw
Laidout Align Tool, Tom Lechner, 2012
This is a screencast of a mockup in laidout software. Laidout is developed by comic-book artist and publisher Tom Lechner. The screencast starts with the current state of the ‘alignment tool’; it offers various methods to arrange multiple elements on a plane.
We are fascinated by the way he plays with mathematical references that seem to be natural companions in the digital context he is working in. It makes for an interesting mix of virtual and physical. Tom Lechner has of course an intimate understanding of the way his tool works and he explains each action from the perspective of this inner-process. The Laidout interface is not there to hide computation, but puts it into to the foreground. His interface acts as a scenery; it is functional through a kind of comic-book presence.
https://www.youtube.com/watch?v=9YT5JIFEqm0
In a second video, Lechner demonstrates meshes, manipulation tactics for images.
https://www.youtube.com/watch?v=lPhzrUc6bq0
The third video concerns paths. What remains interesting is a clickable path direction indicator in which you can add points to the middles of existing lines, or drag them to the direction indicator to start adding a subpath, or a new path object. (Jump to about 1:00 to see that).
How about?
Could we make Tom’s alignment-tool work for text? Could alignment be calculated for blocks of text, lines as well as for individual glyphs? We could add ‘scale’ to the alignment options? What can we learn from the way Laidout allows a view of your actions while interacting with the inner systems of the software?
Exercise
- See how we can apply the way Tom draws interfaces to other tools
- Think through a scenario for an automatic alignment tool would entail. Where would you stop it and take over? Would it be feasible that some elements are still manipulated by the software (‘have strings attached’), and others not?
Elision / Collision


Comparing how the region of La Loma near Medellin is depicted on Google Maps vs. Open Street Maps
This is a summary of two related sets of cases proposed by Nicolas Malevé.
The first image shows how the region of La Loma Hermosa, a region near Medellin, is depicted in Google maps. Drug lords and paramilitaries have found a territorial agreement and as a result the region has an ambiguous status that makes it very hard for inhabitants to demand even the most necessary improvements in infrastructure. Considered as too problematic, the zone has disappeared from the sight of administration and literally from Google maps.
When we look at the same region depicted in Openstreetmaps, roads and houses are present in detail. Your impulse might be to chose one map against another, but only once you have seen the different maps side by side, you begin to understand the empty zones in the Google map as a form of active erasure that follows a particular process. We can sense an image made of the multiple and contradictory visions, and have a sense of La Loma, but it is not an image we can see with our eyes.

Erased de Kooning’s drawing, 1953
In 1953, artist Robert Rauschenberg asked Willem de Kooning if he could erase one of his works. De Kooning accepted and Rauschenberg spent one month erasing his drawing, framed it, and added the legend: “Erased de Kooning’s drawing, 1953”. In the nineties, Antoine Moreau, initiator of the free art license, started Peinture de Peintres: “I ask to the painters I meet to paint on a canvas already painted by another. A painting covers another. This painting has no end. No fixed image. The canvas has a dimension of 88,5 cm/101,5 cm. This is not a compilation of my tastes, neither a collection of paintings.” Every time a painter has ‘covered’ another painting, Moreau uploads a picture of the painting to his web gallery.
http://antoinemoreau.org/g/category.php?cat=4&expand=all
How about?
In your mind you can keep several simultaneous visions of La Loma as an abstract thought. But as soon as you want to visualize them on screen, they will fight for pixel space. Transparencies, layers have each their own system of coordinates. And if we superimpose the different layers, the empty space will become a surface on which things can be projected and it will lose its very quality of active void, its political dimension.
How could software participate in such an image rather than try to represent it? How can software dialog/enrich with the extended dimension of the mental image?
In the case of Rauschenberg, elision takes place on the sheet of paper itself. But mentally we can picture both the erased sheet of paper and a representation of a de Kooning drawing. In the case of Antoine Moreau’s project, elision happens on the canvas too, but this time gradually, and with different intentions. Here they are images of the process: “The quality of these images is approximative and irregular. On the web, it is just a glimpse (sur le web, c’est juste un coup d’oeil)”. Nevertheless they have a certain authority: they re-present the space of collision and co-position.
How can software intervene, find its place in the complex interaction of elision/collision/co-position? How can it enrich both the pixel based and mental spaces without re-producing the processes of erasure?